Hefei Doppler radar observation data over the downstream region of the Yangtze River during the Meiyu period from 2001 to 2003 were analyzed to reveal the predominant structural characteristics of meso-β-scale convective systems (MβCSs) around the Meiyu front. Convective and stratiform portions were separated from MβCSs using the bright band fraction (BBF) method. The daily and yearly mean vertical profiles of radar reflectivity for the convective portion were calculated.
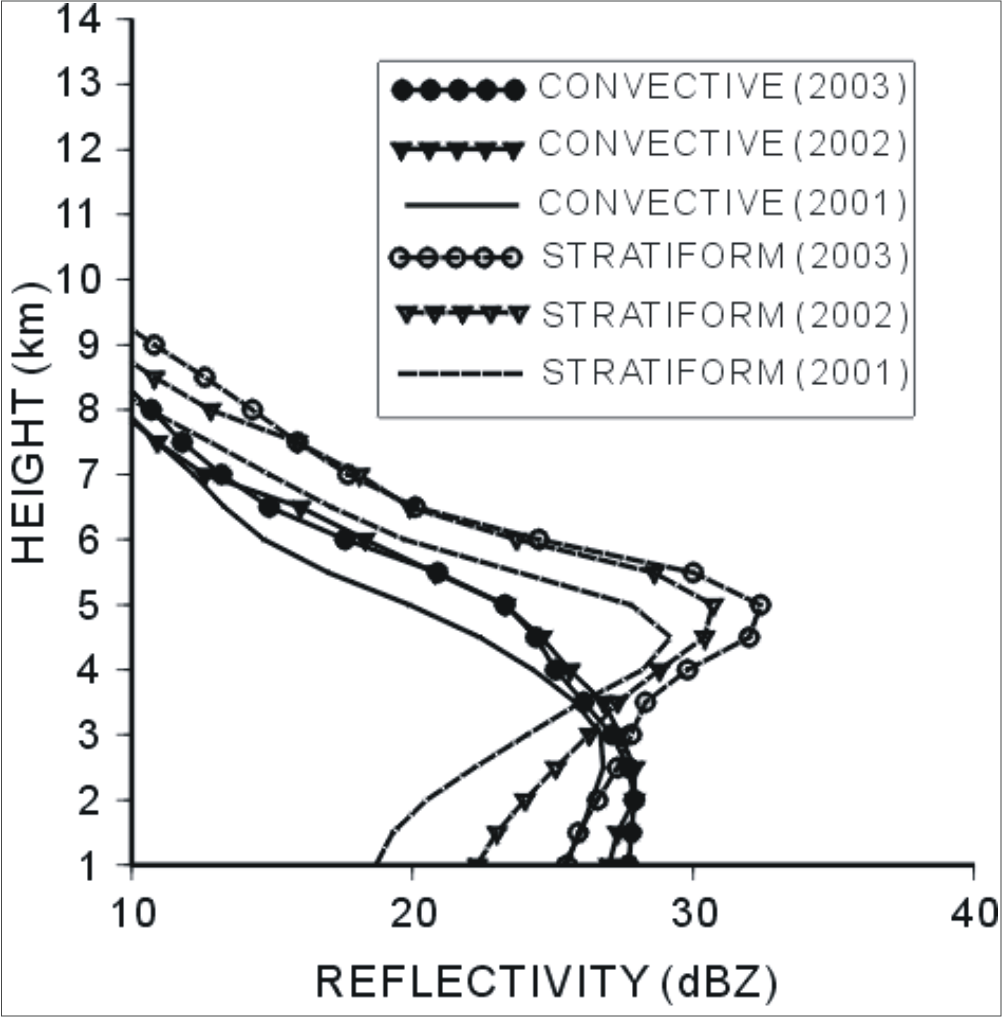
Results showed that the vertical profile of the convective portion of M βCSs for 3 years was characterized by low-altitude radar reflectivity peaks (around 3 km) and large decrease of reflectivity with height above the melting level (Fig. 1). To understand these characteristics of M βCSs, the convection of medium depth (CMD) is defined as a group of convective cells whose echo-top height with a reflectivity of 15 dBZ is equal to or less than 8 km, and the reflectivity peak is below 4 km throughout their lifetime.
To investigate the structural characteristics of MβCSs around the Meiyu front, observed MβCSs were categorized into slow-moving (≤3 m s-1) and south-of-front (SSF) type, slow-moving and along-the-front (SAF) type, fast-moving (≥7 m s-1) and along-the-front (FAF) type, and slow-moving and north-of-front (SNF) type according to their movement speed and their locations relative to the surface front (Fig. 2). The predominant convection in the SSF type was the CMD, which covered 51% of the convective area. The CMD and deep convections (DC) coexisted in the SAF, with the CMD covering 34% of the convective area. The FAF type was organized from the DC, and the SNF type primarily consisted of the CMD. The environmental conditions under which the SSF type formed were characterized by a weak wind convergence (<2×10⁻⁵ s-1) near the surface, a low level of neutral buoyancy, and humid atmosphere below the middle level. The large contribution of the CMD to the convective rainfall amount in the SSF type and its non-negligible contribution to the SAF type indicate that the CMD is one of the main structures of the Meiyu frontal convective precipitation system.
Fig. 1: Yearly mean vertical profile of reflectivity for convective and stratiform portions identified by the BBF method in 2001, 2002, and 2003 within a radar radius of 60 km.
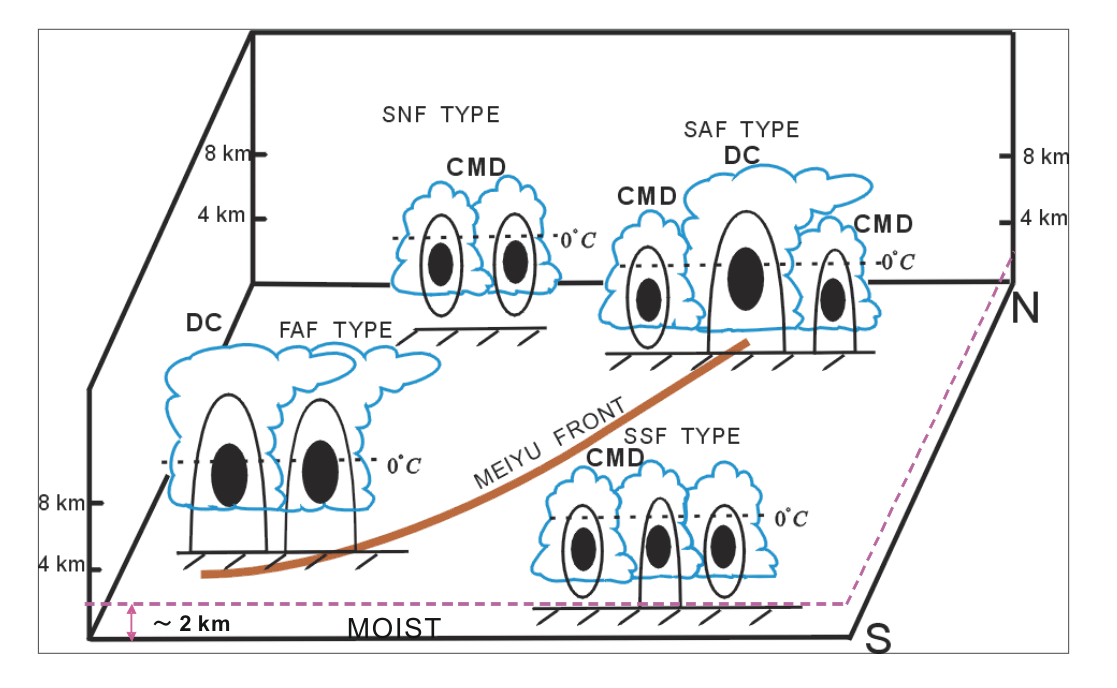
Fig. 2: Schematic illustration of convections for four types of meso- β-scale convective systems around the Meiyu front. The thick solid line indicates the surface front. The dashed line passing through the cloud represents the melting level. CMD and DC represent convection of medium depth and deep convection, respectively. The black ellipse represents the convection core. The line surrounding the black ellipse represents the precipitation region.
To clarify the statistical features of precipitation cells during the Meiyu/Baiu period, Doppler radar data obtained at Shouxian, Anhui Province, China (continental area) from June 17 to July 17, 1998, at Zhouzhuang, Jiangsu Province, China (coastal area) from June 10 to July 13, 2001, and at Okinawa (oceanic area) from May 27 to June 11, 2004 are analyzed. From the radiosonde observations, moist layers were found to exist in the lower (less than 2 km) and middle troposphere (from 2 to 5 km). The following features of precipitation cells over the moist environment in East Asia are obtained: area (horizontal scale), echo-top height, height of maximum reflectivity in each precipitation cell, and vertical gradient of maximum reflectivity above the melting level. In particular, echo-top height and vertical gradient of maximum reflectivity above the melting level are described in detail.
The numbers of analyzed precipitation cells are 2978 at Shouxian, 17529 at Zhouzhuang, and 5093 at Okinawa. The averaged areas of precipitation cells are 16.8 km2 at Shouxian, 22.8 km2 at Zhouzhuang, and 16.4 km2 at Okinawa. There is a tendency for the higher precipitation cells to have a larger area, although this is not clear for cells over 20 km2.
Figure 3 shows the integrated probability density of echo-top height. The ratio of echo-top height that does not exceed the height of the melting level + 1 km is 69.0% at Shouxian, 74.1% at Zhouzhuang, and 80.8% at Okinawa. Precipitation by warm rain should be effective in these areas.
Figure 4 shows vertical profiles of maximum reflectivity at each level. The fact that the vertical gradient of reflectivity above the melting level over the oceanic area is larger than that over the continental area is well known. However, in this study, the vertical gradient of reflectivity above the melting level at Zhouzhuang (coastal area) and Shouxian (continental area) is not obviously small compared with Okinawa (oceanic area). These observations can be attributed to the moist condition in the lower and middle troposphere. In this condition, it would be difficult to develop deep convection because convective instability is easily consumed by convection and is not accumulated. Therefore, almost all of the precipitation cells in the moist environment frequently observed in East Asia during the Meiyu/Baiu period have echo-top heights that reach only to the melting level + 1 km and large vertical gradient of reflectivity above the melting level.
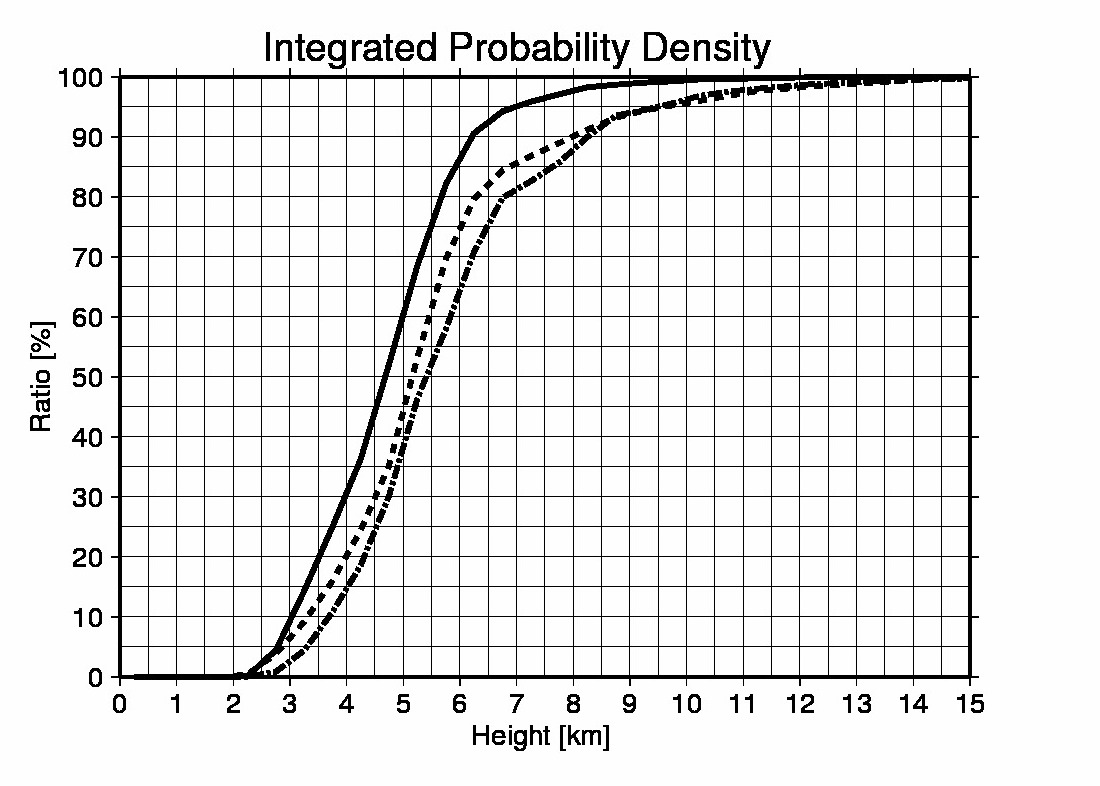
Fig. 3: Integrated probability density of echo-top height at each area. Solid, broken, and dashed lines show Okinawa, Zhouzhuang, and Shouxian, respectively.
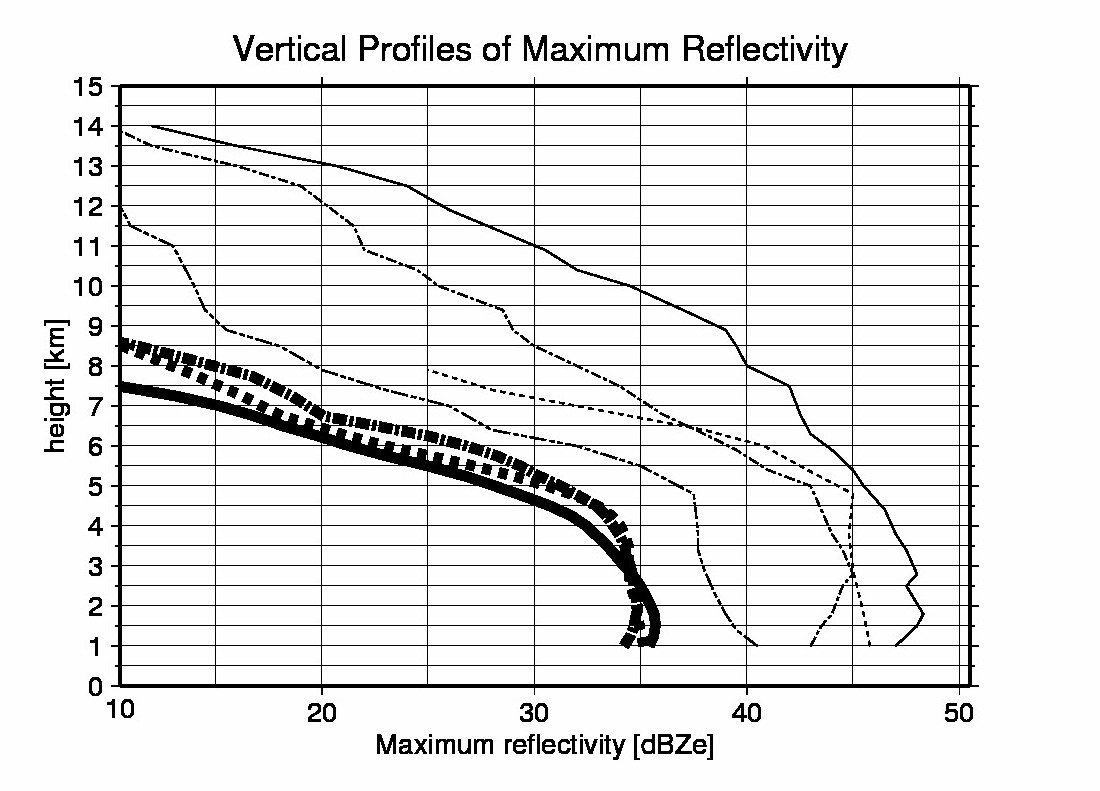
Fig. 4: Vertical profiles of maximum reflectivity. Thick solid, thick broken, and thick dashed lines show Okinawa, Zhouzhuang, and Shouxian, respectively. Thin solid, thin broken, thin dashed, and thin double-dashed lines show Oklahoma (continental), Taiwan (oceanic), Darwin (continental), and Darwin (oceanic) from Zipser and Lutz (1994), respectively.
Previous studies have revealed that the Baiu frontal zone has complicated rainfall distributions. Moteki et al. (2004) revealed the detailed wind and moisture fields that determine one of the typical Baiu frontal rainfall distributions. There were three airstreams: cold and dry northeasterly, oceanic southwesterly, and comparatively moist continental airstream from the west. On June 27, 2004, we conducted aircraft observation of the Baiu frontal zone around the East China Sea to reveal these structures and found a new cloud pattern unaccountable by the structure shown in Moteki et al (2004). This implies another structure in the Baiu frontal zone.
Therefore, we conducted another aircraft observation on June 23, 2005. First, we observed the meridional profile at 500 m from 31°N to 25.5°N along 125.9°E. Second, we conducted dropsonde soundings from 12000 m at 4 points (25.9°N, 27.0°N, 28.0°N, and 29.5°N).
Figure 5 shows the results of the 500 m flight. There are two ascending areas: X was weak and wide (28-29.8°N); Y was strong and narrow (26.2-26.8°N). Corresponding to these ascending areas, there were two wind shears: northeast-southwest for X and west-southwest for Y, respectively. Ascending area X had weak precipitation, while ascending area Y had heavy rainfall. Moisture contrast was apparent around the northern edge of the ascending area X. Figure 6 shows the results of dropsonde soundings. Dropsonde points were located at the north and south sides of each ascending area. To the south of the ascending area Y (dropsonde 1), the lower level below 500 m was very moist and convective unstable. To the north of the ascending area Y (dropsonde 2) and south of the ascending area X (dropsonde 3), the atmosphere was comparatively moist and weakly convective unstable. To the north of the ascending area X (dropsonde 4), there was convective neutral stratification and low-level cold inflow.
To understand the detailed structure of the Baiu frontal zone, we performed numerical simulations using the Cloud Resolving Storm Simulator (CReSS). Back-trajectory analysis revealed the wind field around the Baiu frontal zone. As shown in Fig. 7, there were four airstreams: northeasterly, west-southwesterly, southwesterly-1, and southwesterly-2. The atmospheric properties of these airstreams correspond to the features shown in dropsonde 4, 3, 2, and 1, respectively. The convergence among these four airstreams, which had different moisture stratifications, resulted in northern weak and southern heavy rainfall.
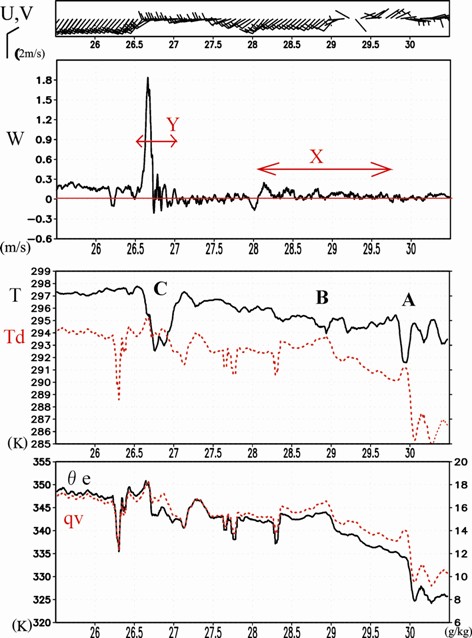
Fig. 5: Meridional profiles of horizontal wind, vertical wind, temperature and dewpoint temperature, and equivalent potential temperature and mixing ratio of water vapor on June 26, 2005.
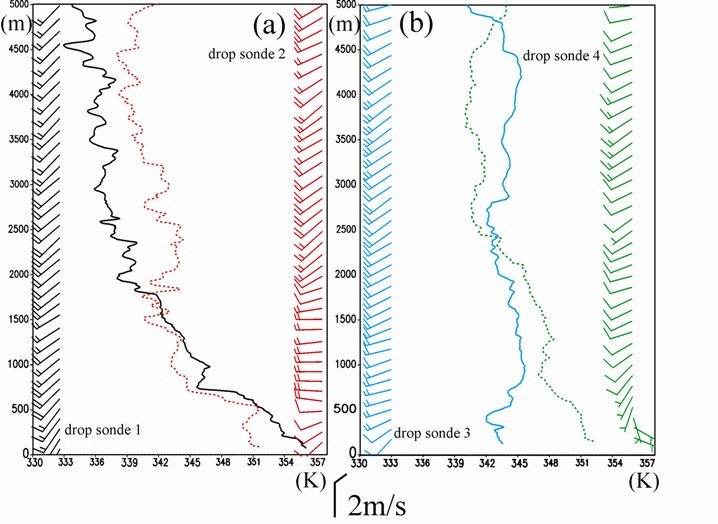
Fig. 6: Vertical profiles of equivalent potential temperature obtained from the dropsonde soundings.
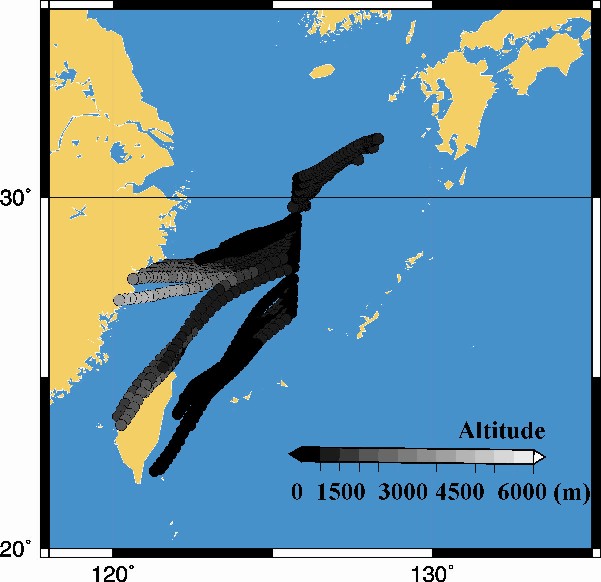
Fig. 7: Back-trajectory analysis chasing 30 airmasses at 500 m height along 125.5°E. Gray scale shows altitude.
The aim of this study is to examine the structure of cloud clusters that develop into tropical cyclones in the western Pacific tropical region. We carried out observations on cloud clusters with two Doppler radars in the Republic of Palau in the western Pacific tropical region from June to July 2005. A cloud cluster of 1000-km diameter passed the Republic of Palau from July 1 to 2 (Fig. 8) and developed into a tropical cyclone over the Philippines from July 3 to 4. In this study, the structure of the cloud cluster was examined in detail with Doppler radar data before its development into a tropical cyclone.
With GOES-IR data, the west of the cloud cluster consisted of a long-lived mesoscale convective system (MCS) of about 36 h (Fig. 8). The major and minor axes of the MCS were about 400 and 300 km, respectively.
With Doppler radar data, the structure of the MCS was examined. The MCS moved to the west at a speed of 5 m s-1, and a line-shaped rainband formed ahead of the MCS. The stratiform region is located on the eastern side of the line-shaped rainband (convective region) in the MCS. In the stratiform region, a mesoscale vortex at the middle level (from 3 to 8 km) was analyzed assuming that a system was steady (Fig. 9). The vorticity was 7.3×10⁻⁵ s-1 with a diameter of 323 km by a calculation with several assumptions.
The long-lived MCS with a developed line-shaped rainband in the west part of the cloud cluster moved westward after the cloud cluster decay. The cloud area of the MCS split at 00 UTC on July 3 and a newly developed convective area moved north and developed into the tropical cyclone over the Philippines. In other words, the tracked MCS was a system that developed into the tropical cyclone. Recent studies showed that a developed mesoscale vortex in MCS greatly contributed to the development of tropical cyclones. The characteristics of the mesoscale vortex (i.e., depth, horizontal scale, and vorticity) shown in this study were compared with those of previous studies, and the order of the vorticity was the same; that is, the observed MCS that developed into a tropical cyclone after 48 h had a vortex in the middle troposphere. This study suggested the necessity to observe and track the mesoscale vortexes 48 h before their development into the tropical cyclone.
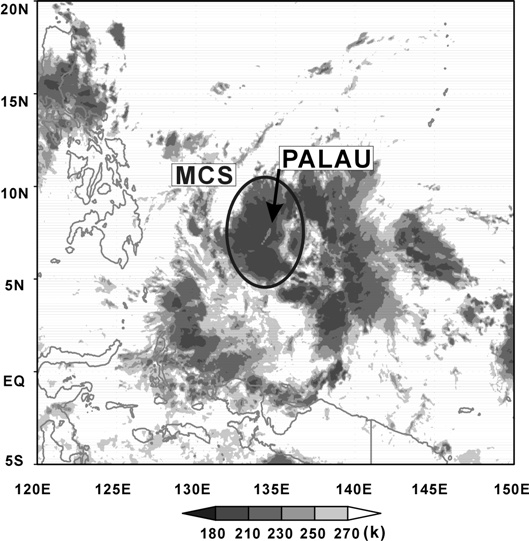
Fig. 8: GOES-IR image at 00UTC 2 July around Palau. The location of Palau is indicated by an arrow. The ellipse indicates the target MCS.
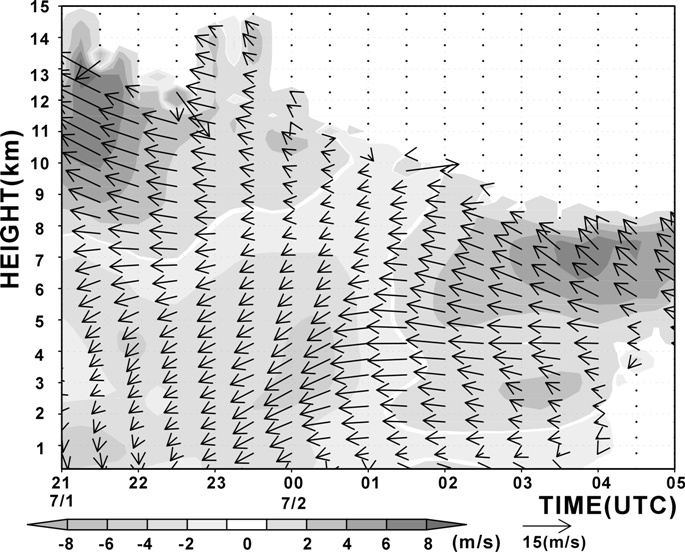
Fig. 9: Time-height cross section of horizontal wind (arrows) and their meridional component (shades) when the MCS passed.
For the purpose of understanding mesoscale winter snow storms, Nagoya University installed a dual Doppler radar system on the coast of the Sea of Japan from December 2002 to February 2003. On January 29, 2003, strong cold air moved over northern Japan and active snow clouds were observed over the Sea of Japan. On this day, during the period from 18 JST to 20 JST, the dual Doppler Radar system observed a selectively developed snowband whose echo-top height exceeded 5 km. The snowband was different from the disturbance associated with the Japan Sea Polar-airmass Convergence Zone (JPCZ), and the influence of geographical features and land breeze were not found. To reveal the structure and formation process of the developed snowband, we investigated the dual Doppler radar data and numerical simulation model CReSS.
From the Doppler radar observation, convective cells, which compose the snowband, developed both upstream and downstream of the snowband and lined up along the predominant wind direction and organized linear structure (Fig. 10). In the lower layer, west-northwesterly wind was observed on the north side of the snowband, while westerly wind was observed on the south side. A clear convergence line was formed along the snowband in the lower layer. In particular, at the downstream region of the snowband, the northerly inflow from a long distance was observed on the north side of the snowband and the low-level convergence was intensified. An enhancement of the low-level convergence contributed to the longevity of the convective cells in the upstream region of the snowband and to the occurrence of convective cells in the downstream region of the snowband. Therefore, this played an important role in maintaining the linear structure of the snowband.
As a result of numerical experiments, when the snowfall system associated with the JPCZ began to decay, the corresponding snowband formed on the south side of the JPCZ. In the lower level, cold air was present in the southern edge of the snowband and high equivalent potential temperature air was inflowing from the north side (Fig. 11). Owing to the convergence of these airmasses, high equivalent potential temperature airmass was uplifted and formed convective cells. As a result, the snowband developed on the south side of the JPCZ. Furthermore, it is important to reach high equivalent potential temperature airmass to the south of the JPCZ. The snowfall system associated with the JPCZ should be in the decaying stage because the upper layer cold air was moving away from the Sea of Japan, and the stability of the atmosphere was increasing.
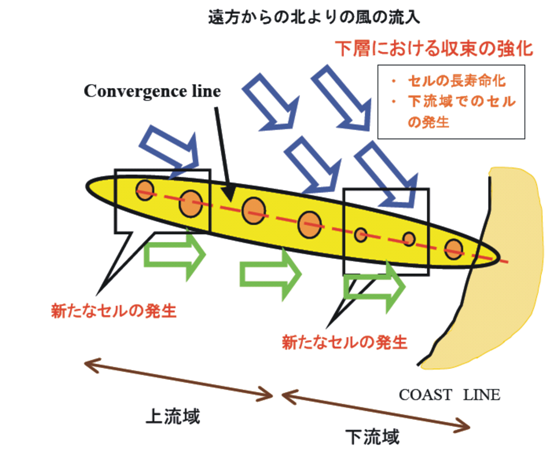
Fig. 10: The basic concept of the snowband structure shown by dual Doppler radar data analysis. Arrows show relative wind direction for the storm, and circles represent convective cells.
Fig. 11: The process of the snowband was selectively developed south side of the JPCZ. When the snowfall system associated with the JPCZ is in the decaying stage, high potential temperature air can reach the south side of JPCZ.
We developed a Lightning Simulator that simulates charge distribution in thunderstorms and lightning on the basis of the Cloud Resolving Storm Simulator (CReSS).
Lightning activity of thunderstorms was simulated in two steps. The first step was the accumulation of electric charge by charging of cloud particles. The second step was discharge by lightning. In developing the Lightning Simulator, we introduced variables of charge as a prediction variable in the CReSS. First, we used the riming electrification: ice crystal, snow, and graupel that took charge in the microphysical process. Then, we described the formation of charge by riming electrification. Next, we calculated the electric potential and electric field from the charge distribution. We used the lightning parameterization that used the electric field as the threshold value of lightning initiation and parameterized discharge.
Thunderstorms that took lightning on the ground in summer formed the tripole structure of the charge distribution: the positively charged region in the upper layer, the negatively charged region in the middle layer, and the small positively charged region in the lower layer. We performed the ideal two-dimensional experiment to examine the reproducibility of the tripole structure of charge distribution within the riming electrification and lightning parameterization. The horizontal resolution was 500 m and artifactual sounding data were used as initial field. Simulated thunderstorms took the cloud-to-ground discharges and cloud flashes. The tripole structure of the charge distribution was formed in the model (Fig. 12).
Next, we performed a three-dimensional experiment of the thunderstorms developed over Aichi Prefecture of Japan on August 12, 2006. We compared the lightning strike points in the model with those observed by the Lightning Location System (LLS) operated by Chubu Electric Power Co., Inc. The horizontal resolution is 4 km and realistic environment data is used as the initial field. Although the timing and area of the lightning strikes were not exactly simulated in the model, we could reproduce the lightning strikes over the Aichi Prefecture with thunderstorms (Fig. 13). In this experiment, the Lightning Simulator could simulate the thunderstorm that took the lightning on the ground.
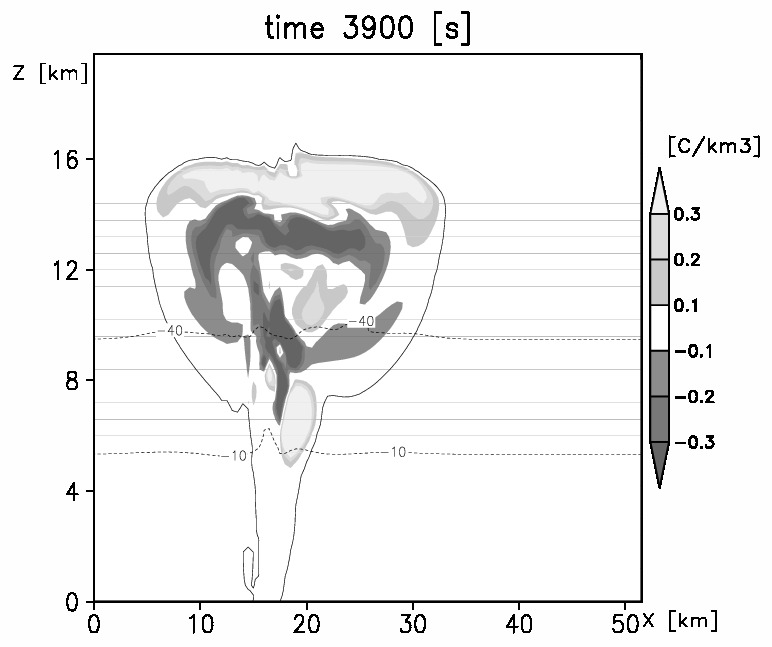
Fig. 12: A vertical cross section of total net charge of cloud water, rain, ice crystal, snow, and graupel at 3900 s. Shade represents net charge (C km-3); solid line represents cloud border, and broken lines denote temperature (°C).
Fig. 13: Frequency of simulated lightning in three-dimensional experiment.